
Commodity Markets Guide
We are dedicated to empowering traders, businesses, and investors with comprehensive access and insights into the dynamic world of commodity trading.

Commodity Trader Platform
We specialize in connecting our clients with the top commodities traded globally, leveraging our extensive network and deep market knowledge to source and trade a wide array of products.
Commodity Markets: A Beginner’s Guide
An introductory guide for newcomers to the commodity trading world.
Top 10 Most Traded Commodities Worldwide
An overview of the most in-demand commodities in the global market.
Understanding Commodity Market Trends
Insight into current trends and market forecasts for the year and the future.
Risk Management Strategies
A guide to managing risks and protecting investments in commodity trading.
Commodity Trading Regulations
Information on legal and regulatory aspects of commodity trading.
The Impact of Geopolitical Events
Analysis of how global events influence commodity markets.
An array of resources
Our platform is more than just a trading hub; it’s a rich resource of market intelligence, real-time data, and expert analysis.
Commodity Trader Alerts
- Collaborate with fellow traders.
- Broadcast your commodity orders.
- Experience the world of networkers.


Commodity Trader News
- A world of thought-provoking articles.
- Make informed decisions in this fast-paced market.
- Detailed Commodity Market price insights.
“Join us to explore the endless opportunities in the world of commodities and take your trading to the next level.”

Aaron A Day
CEO, Lions Gate Digital
Commodity Market News
-
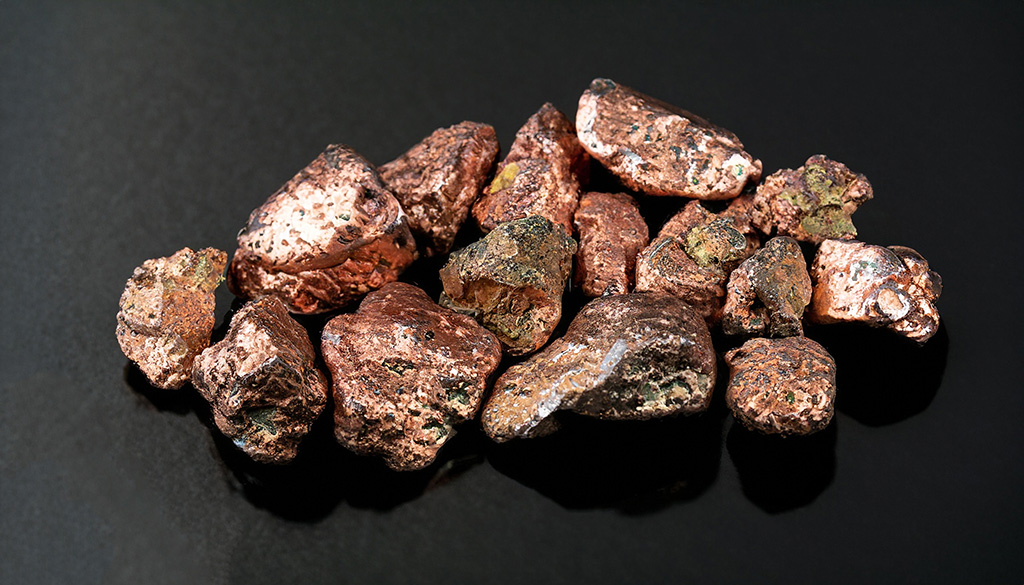
Exclusive Opportunity: Premium Copper Concentrate Available for Export
Tap into the Power of Copper: A Lucrative Investment Awaits In the dynamic world of commodity trading, securing access to high-quality materials at competitive prices is key to leveraging market opportunities and driving profitability. Today, we are thrilled to announce an exclusive opportunity for investors and traders looking to diversify their portfolios or bolster their…
-

Standard Iron Ore Trading Agreement (SIOTA)
When it comes to iron ore trading, there are standard contract terms that buyers and sellers often follow. Let’s delve into some key aspects: Remember, these are general guidelines, and specific contracts may vary based on individual negotiations and market conditions. Professional legal advice is essential for any iron ore trading agreements 12.
-
Mastering the Art of the Deal: A Guide for Independent Commodity Brokers
In the fast-paced world of commodity trading, independent brokers play a crucial role in bridging the gap between buyers and sellers. However, navigating this terrain requires more than just market knowledge and negotiation skills; it demands a solid legal and contractual foundation to protect your interests and ensure fair play. This blog post outlines essential…
-

Navigating the Riches of the DRC: Copper and Cobalt Market Dynamics
The Democratic Republic of Congo: A Mineral Powerhouse The Democratic Republic of Congo (DRC) stands as a colossus in the global commodity markets, particularly for copper and cobalt. These two metals are essential components in the burgeoning sectors of renewable energy, electronics, and electric vehicles, making them highly sought after on the international stage. This…
-

The Rising Star in Livestock: The Economic Potential of Bison
The bison industry is carving a unique niche within the agricultural market, emerging as a lucrative alternative to traditional livestock. Known for their robustness and the nutritional superiority of their meat, bison are becoming a focal point for producers looking to diversify their operations. This blog post delves into the import and export statistics of…
-

The Frozen Treasure: Unveiling the Presumed Mineral Wealth of Antarctica
Antarctica’s Veiled Resources Beneath the vast, icy expanse of Antarctica lies a treasure trove of mineral wealth that has intrigued scientists, policymakers, and commodity traders alike. This remote continent, known for its extreme cold, pristine landscapes, and unique wildlife, is also presumed to be rich in a variety of mineral resources. These include metals critical…
-

The Belt and Road Initiative: Reshaping Global Trade and Investment Landscapes
A Visionary Blueprint for Global Development The Belt and Road Initiative (BRI), proposed by China, represents one of the most ambitious international cooperation and development projects of the 21st century. Aiming to weave a network of trade routes and partnerships reminiscent of the ancient Silk Road, the BRI seeks to enhance global trade, bolster economic…
-

The Financial Horizon of Solar Energy: Trading Renewable Energy Certificates and Carbon Credits
Catalyzing a Green Economy Through Solar Farms The transition towards renewable energy has not only been a leap towards sustainability but also a lucrative financial opportunity for commodity traders. Among the myriad of options, Renewable Energy Certificates (RECs) and carbon emissions credits derived from solar farms stand out. These instruments serve as a testament to…
-

Harnessing the Sun: Renewable Energy Certificates and Carbon Emissions Credits from Solar Farms
A New Dawn for Green Investments The global shift towards renewable energy sources has opened up innovative pathways for commodity traders and investors, particularly in the realms of Renewable Energy Certificates (RECs) and carbon emissions credits. Solar farms, pivotal in this green revolution, are not just producing clean energy but also generating valuable certificates and…
-

Cocoa Prices Reach Unprecedented Highs: Navigating the Surge Ahead of Valentine’s Day
A Sweet Spike in Cocoa Costs As Valentine’s Day approaches, a time when chocolate demand typically soars, the cocoa market has experienced a dramatic surge, reaching an all-time high. On Friday, cocoa futures closed at an astonishing $5,888.00 per ton, surpassing the previous day’s record. This sharp increase, with prices more than doubling over the…
Join 900+ subscribers
Stay in the loop with everything you need to know.